“Are we getting value from our martech?” This million-dollar question plagues marketers, martech managers and C-suite executives alike. As the marketing technology landscape expands, martech managers will find themselves in a vulnerable position when faced with potential budget cuts.
To assess the real impact of martech on company value today, you should:
- Focus on effectiveness, not efficiency metrics. Focus on success, not failure. Current martech metrics are not doing the job.
- Stop treating martech alike across industries. The Martech Value Matrix shows where martech maturity increases or reduces company value.
- Take CRM as an example. CRM plays a very different role across industries.
1. Focus on effectiveness, not efficiency metrics
Unfortunately, martech managers lack effective tools to assess and show the impact of martech. They rely on anecdotal user reviews, interview-based software overviews by analysts, and methods like calculating the martech utilization rate and total cost of ownership (TCO).
Anecdotal user reviews and analysts’ overviews are challenging because they do not consider company-specific and unique conditions, making them less convincing to internal stakeholders. Companies only use one-third of their martech capabilities. The challenge with martech utilization is that it focuses on the use of software instead of the value it creates for the company. The same applies to total cost of ownership.
These tools don’t show the true value of martech. They focus on efficiency (saving money) rather than effectiveness (making money). Efficiency is about doing things right, which benefits the company. Effectiveness is about doing the right things, which benefits the customer and makes a stronger business case. Efficiency is good, but effectiveness is 10 times better.
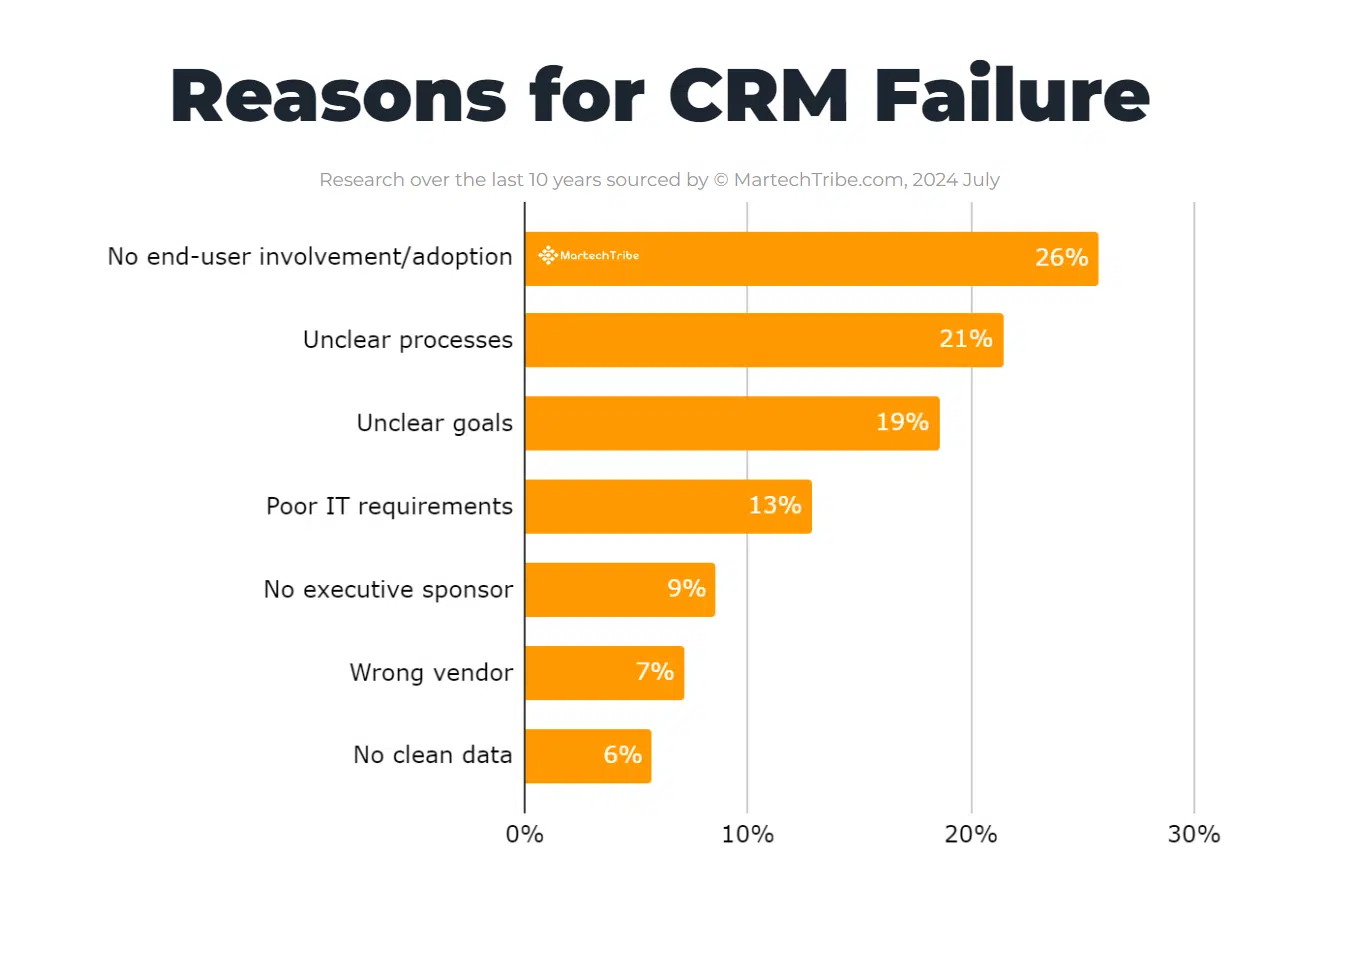
Making things worse, there are frequent reports of software failures instead of useful tools. For example, many reports show high failure rates for CRM implementations.


These reports also highlight the main reasons for failure, such as ignoring the user and unclear goals, which make up 66% of the mentions. However, they don’t explain how to get value from martech. The focus is on failure, not success. Successful martech drives company value rather than just being better chosen and implemented.


The key challenge is connecting martech investments to overall business performance. Our research at chiefmartec and MartechTribe over the past years addresses this issue. When we discuss “company value,” we’re not referring to ROMI or campaign ROI but to the total company value reported in annual reports. This approach provides a more comprehensive view of martech’s impact.
2. Stop treating martech alike across industries
Over the past five years, our team has studied the relationships among software vendor size, company stack size, revenue, headcount, age, industry, business model, and specific martech components. We have conducted hundreds of data experiments with our team of data scientists using our martech data warehouse, which contains 14,106 customer technology tools and data from 1,356 global, real-life, cross-industry customer technology stacks and 4,758 requirements. Here is what we found:
- Martech is used very differently across industries.
- Martech is used differently by business models (e.g., B2C, B2B and B2B2C).
- Martech is used moderately differently by company size (i.e., revenue or headcount).
- Outperformers (i.e., the top 30% of companies ranked on revenue-per-employee ratio) show coherent martech patterns.
A new martech value metric
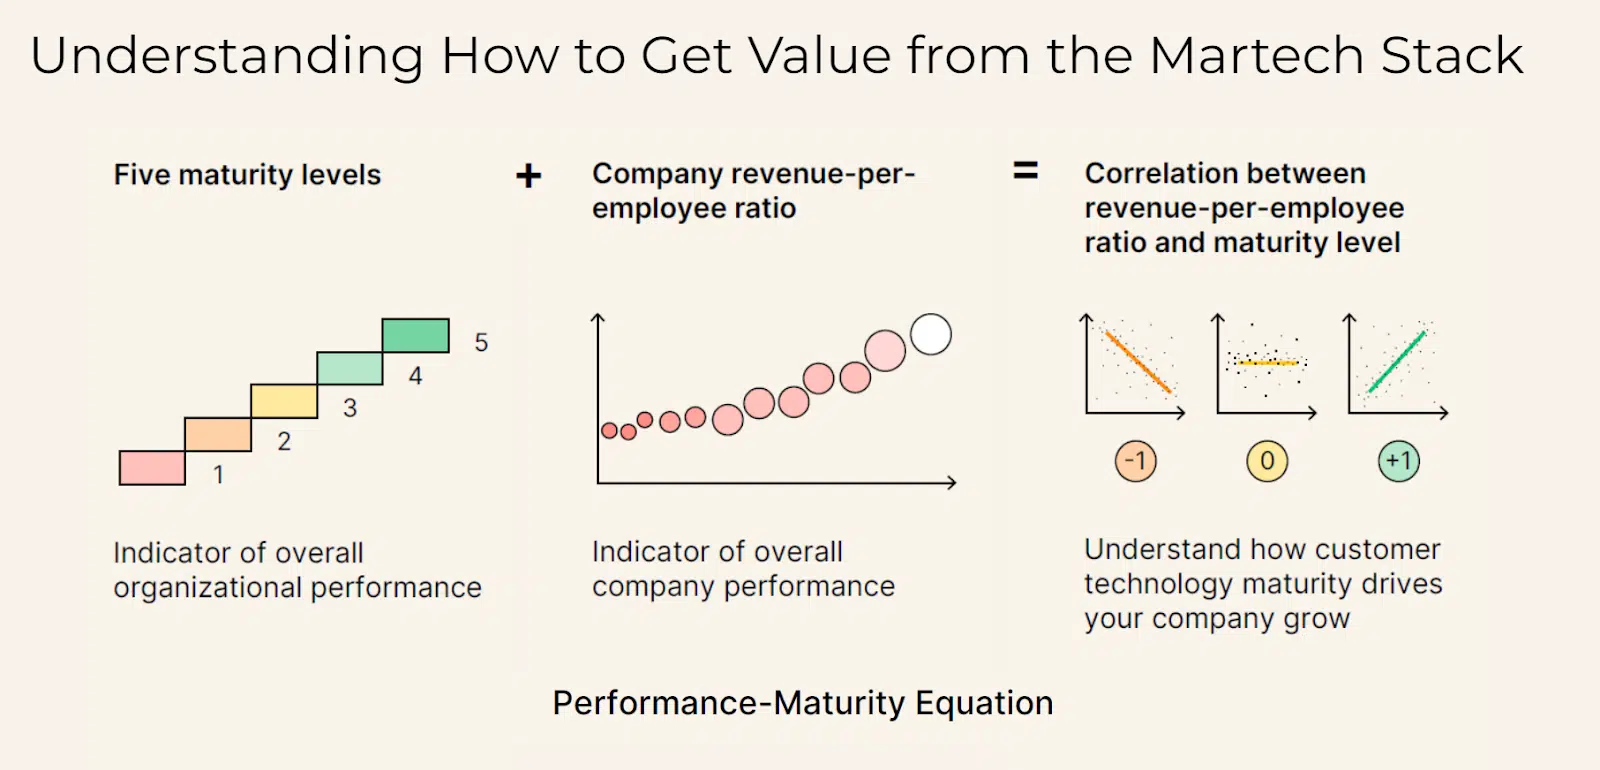
We found a martech value metric that combines all four insights. It is only a start, but it is already very promising and insightful. The metric combines external and internal company performance.
- External performance: Measured by the revenue-per-employee ratio, this metric (a.k.a. net income per employee (NIPE) provides a comparative view of company performance within its industry.
- Internal performance: Utilizing a Likert scale based on the Capability Maturity Model from Carnegie Mellon University, identifying five maturity stages: Initial, Managed, Defined, Quantitatively Managed and Optimizing.


By correlating these two metrics, we can identify whether increasing martech maturity correlates with improved business performance. There are three potential correlation outcomes:
- Positive correlation: Increased maturity correlates with a higher revenue-per-employee.
- Negative correlation: Increased maturity relates to a decrease in revenue-per-employee.
- No significant impact: Maturity is not significantly linked to the revenue-per-employee ratio.
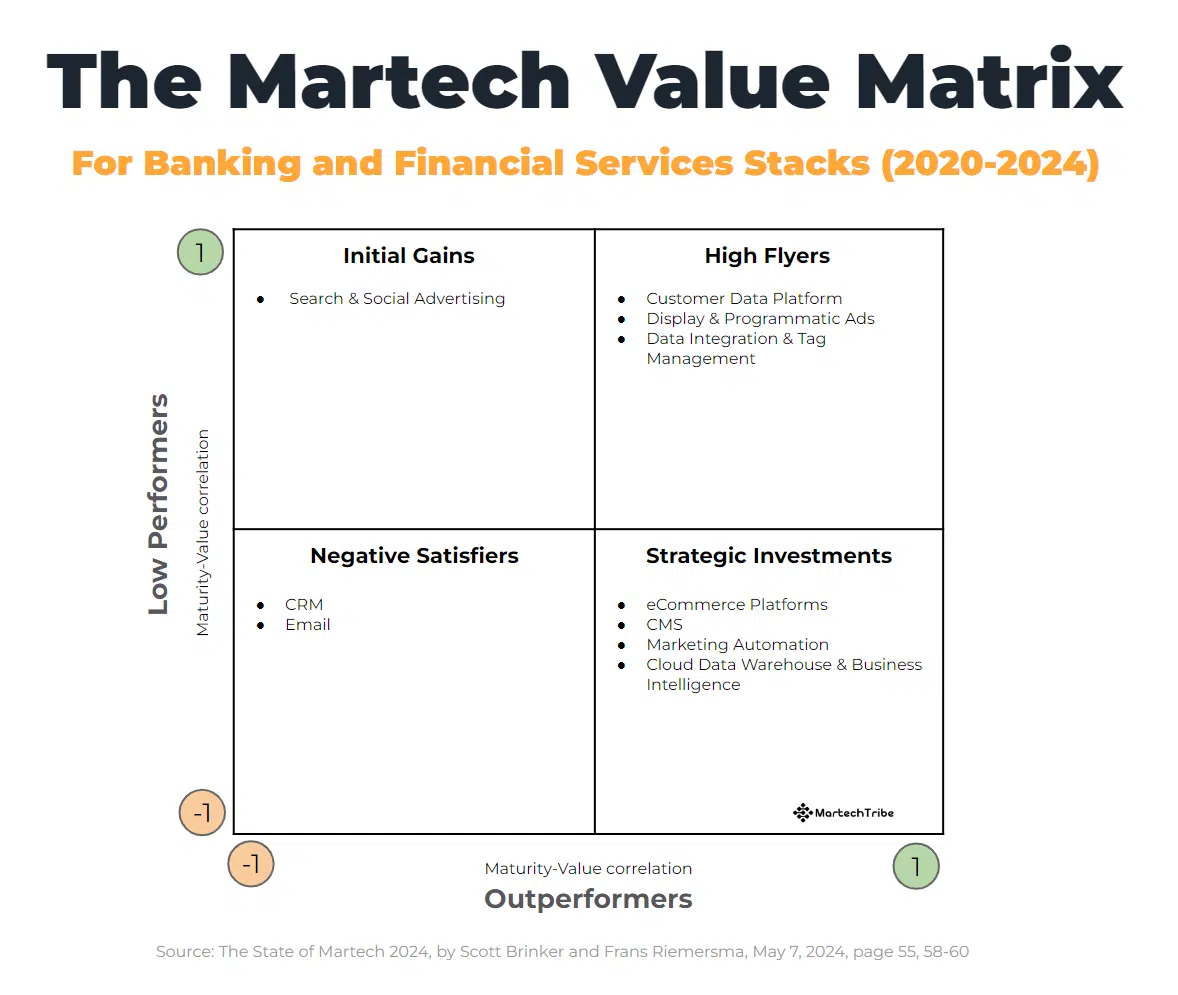
If we want to understand what successful companies do, we have to look at what the outperformers do. By comparing their investment behavior with that of low performers, we see a matrix emerge.
The Martech Value Matrix combines the positive and negative correlations of both outperformers and low performers. The four possible combinations tell us how martech is used in specific industries. Below is a (selection of) the correlations of martech used in the banking and financial services industry.


Reading the matrix clockwise, we see that specific martech performs very differently within the industry.
- Martech high flyers
- Both outperformers and low performers benefit from increased maturity.
- When low performers become outperformers, they will likely replace search and social advertising with programmatic ad buying.
- Strategic martech investments
- Outperformers benefit, but low performers need to address foundational issues first.
- Ecommerce platforms handle both web and mobile app banking services. Low performers don’t use these platforms as effectively as high performers do.
- Negative satisfiers
- These are essential tools, but they can be over-engineered and lead to over-investment. It’s best to focus on getting the basics right.
- Email marketing solutions are required but should not be overutilized. The outperformers found it effective to stick to the core function of email marketing tools: high deliverability of their value-driving newsletters.
- Martech for initial gains
- Low performers see initial benefits, but gains taper off as maturity increases. Low performers seem to benefit from increasing maturity but not outperformers.
- In this case, search and social advertising offers a relatively cost-effective way to gain (initial) traction and market share.
3. Take CRM as an example: The CRM Value Matrix
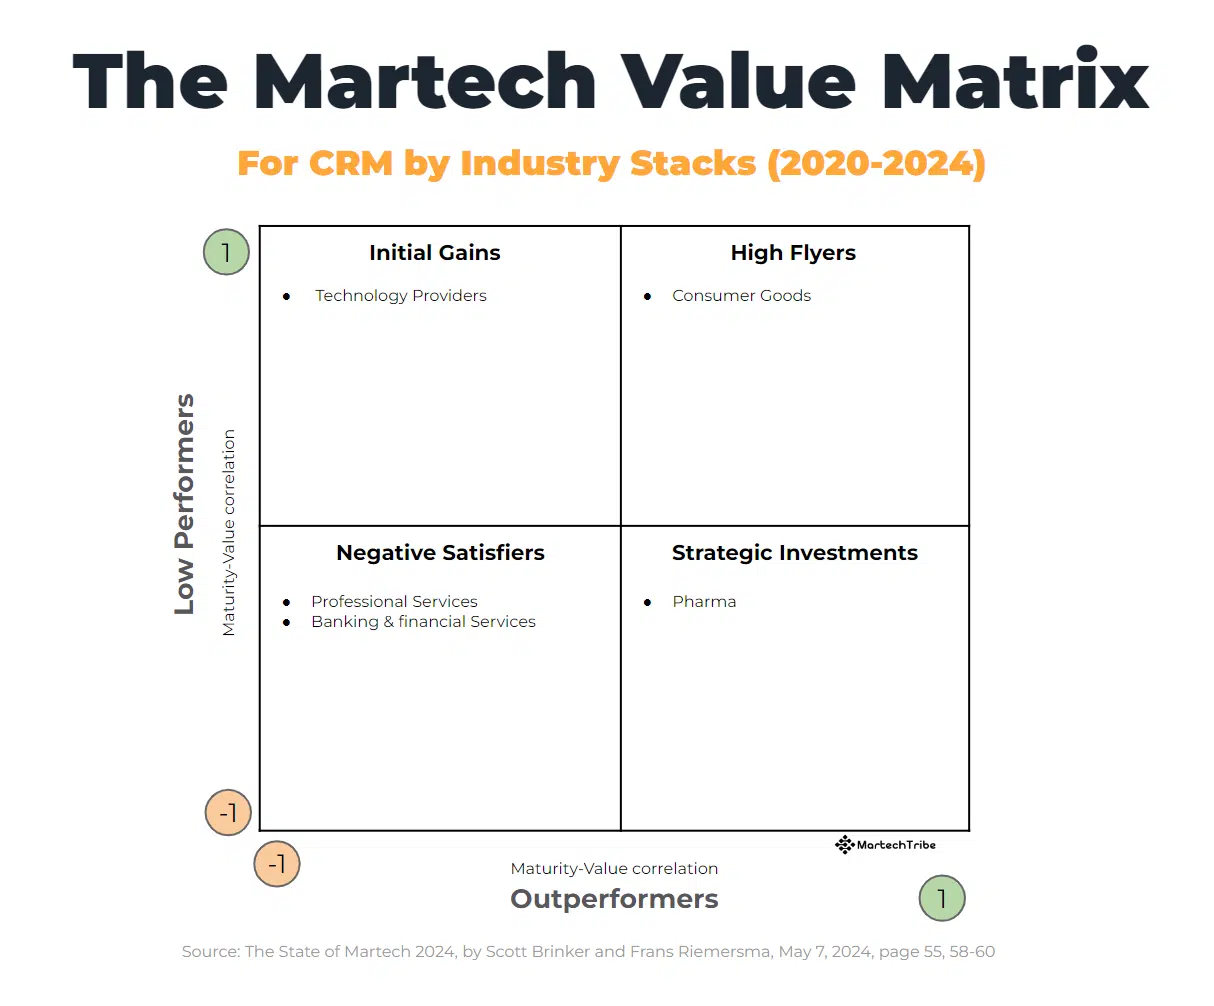
Reflecting on the reasons for CRM implementation to fail, the CRM Value Matrix adds some nuanced insights.
- CRM is a negative satisfier in the case of the banking and financial services industry. A
“Negative satisfier” refers to a martech solution that is indispensable in a stack but should not be over-engineered. In this case, 73% of the outperformer banking stacks include a CRM. That high percentage shows CRM is used as a cornerstone without having to implement it in its fullest capacity. This might be reported as a CRM failure for not implementing all modules across all business units, but it is, in fact, an example of good use. - Outperforming pharmaceutical companies use CRM as strategic martech investments. The many country-specific legal constraints force pharmaceutical companies to use CRM in a very sophisticated way or else fail. Here, we often see highly customized CRMs or CRMs that are country- or industry-specific.
- Professional services companies such as consultancies have stripped CRM to its bare minimum, serving as a digital Rolodex with some modest sales forecasting. As account managers have established one-on-one relationships with their clients, they are likely to keep documentation and note-taking to a minimum. Handovers to colleagues can be done verbally at will.


Contributing authors are invited to create content for MarTech and are chosen for their expertise and contribution to the martech community. Our contributors work under the oversight of the editorial staff and contributions are checked for quality and relevance to our readers. The opinions they express are their own.


![Key Metrics for Social Media Marketing [Infographic] Key Metrics for Social Media Marketing [Infographic]](https://www.socialmediatoday.com/imgproxy/nP1lliSbrTbUmhFV6RdAz9qJZFvsstq3IG6orLUMMls/g:ce/rs:fit:770:435/bG9jYWw6Ly8vZGl2ZWltYWdlL3NvY2lhbF9tZWRpYV9yb2lfaW5vZ3JhcGhpYzIucG5n.webp)


